Posted inAngular 21 Savanka Helps
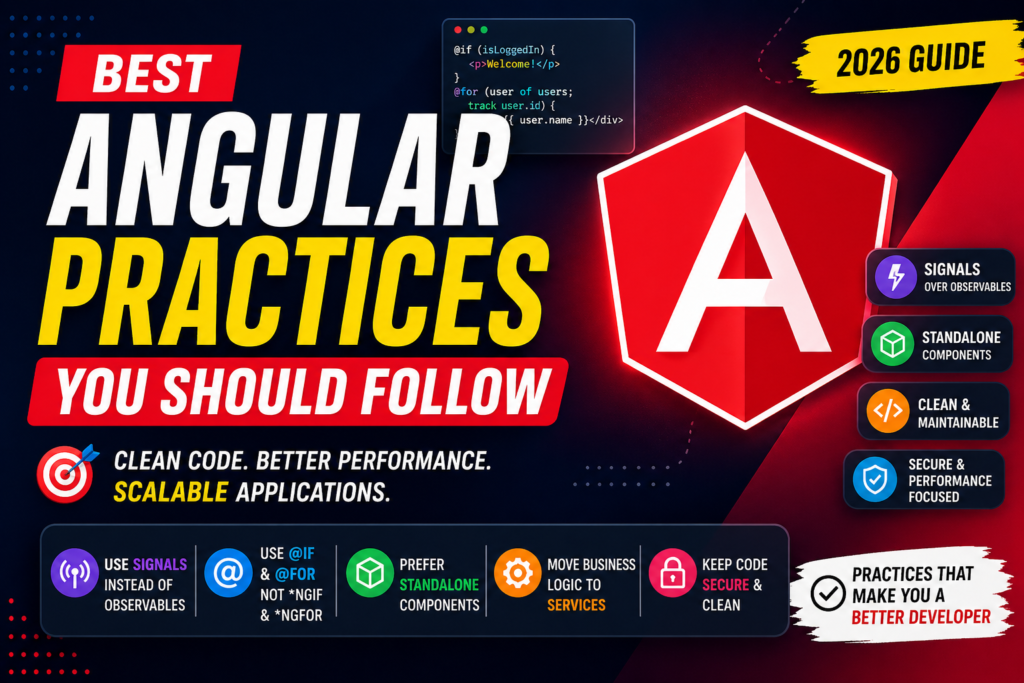
Best Angular Practices You Should Follow in 2026
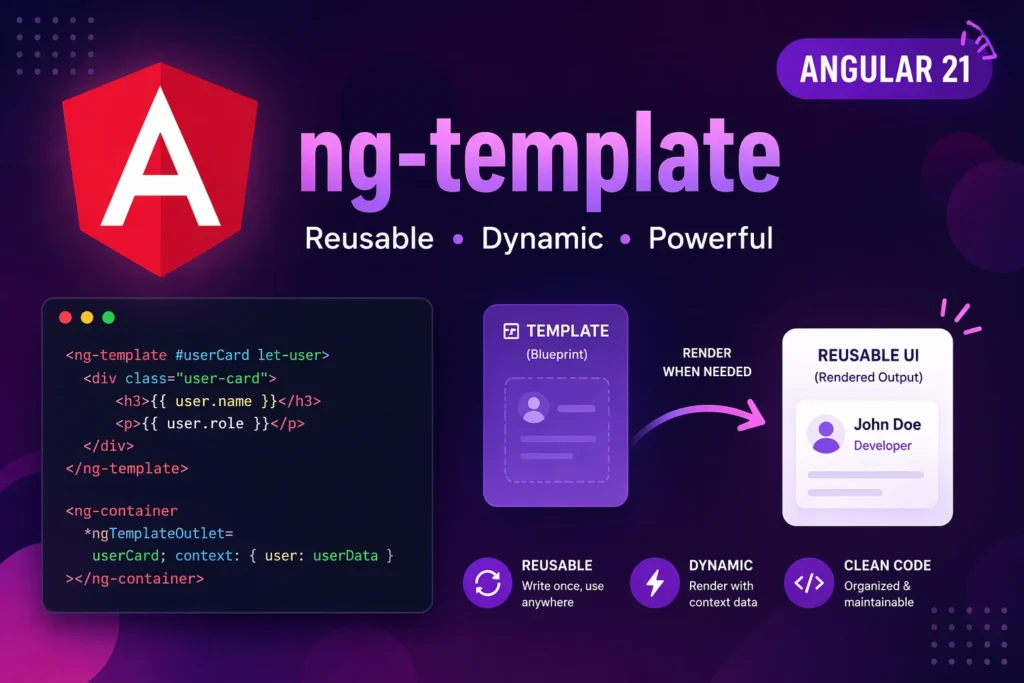
Angular has evolved rapidly, especially after the introduction of signals, standalone APIs, and new control flow syntax. If you're still writing Angular like it’s 2020, you're leaving performance, maintainability, and…